USA Springtime
Ozone Pathways
Cooper O. R., et al. (2005),
A springtime comparison of tropospheric ozone and transport pathways
on the east and west coasts of the United States, J. Geophys. Res.,
110, D05S90, doi:10.1029/2004JD005183. Full
Text
A study is conducted to determine the
influence of Asian pollution plumes on free tropospheric ozone above
the west coast of the United States during spring, as well as the impact
of North American emissions on east coast free tropospheric ozone. Ozonesonde
profiles from four sites are used: Trinidad Head, CA, Huntsville, AL,
Wallops Island, VA, and the MOZAIC site. Only in the lower layers did
the three east coast sites (0-1 km layer for MOZAIC, 0-1 and 1-2 km layers
for Wallops Island and Huntsville) have statistically significant greater
ozone than the west coast site (Trinidad Head).
A particle dispersion model (FLEXPART) was used to determine the surface
source regions for each case, and the amount of anthropogenic NOx tracer
that would have been emitted into each air mass. The amount of NOx tracer
emitted into the east coast profiles was much greater in the lower and
mid troposphere than at the west coast; however, no significant difference
was found in free tropospheric ozone between the east and west coasts
of the United States during spring.
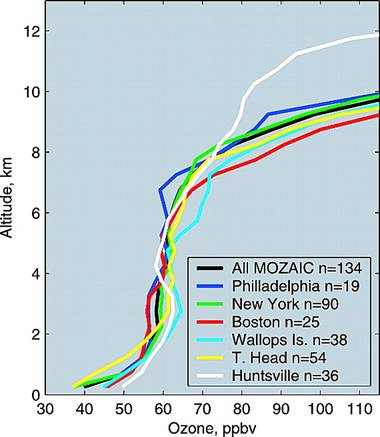
Figure 4. Mean ozone profiles
for April–May at six locations in the United States. The MOZAIC
data (Boston, New York City, and Philadelphia) represent the years
2000–2002, while the other locations represent 2000–2003.
Data are reported every 500 m and represent 500 m layer averages.
|